First, let me preface this with the following: my homemade instrumentation is by no means intended as a substitute for scientific grade research equipment. I certainly did not go out and spend thousands of dollars on research grade equipment, nor did I spend hours and money on scientific calibration techniques. What I did is collect a bunch of decent sensors which had decent specifications befitting of someone who wanted to collect data in the field and check it out later. Before taking it out in the field, I compared it with ASOS readings nearby and was usually within a degree on temperature, a percent or two on humidity and 1 hPa on pressure. I considered that good enough for my purposes. You can review the parts I’ve selected for my measurements in my mesonet build project posts earlier on this blog.
With that out of the way, I thought I post my data findings from my mesonet’s first successful tornado intercept. What I will do is just present a smattering of interesting readings I took leading up to the Mapleton EF-3 tornado. These are nothing but interesting to myself, and do not imply some revolutionary discovery into tornado-genesis. I like data, data is fun, some of you might like data, too. Here we go.
Prior to the Mapleton tornado at 7:24pm CST, with our chase team positioned along highway 175 at the intersection with 140th st we stopped for a few seconds and the conditions at that location were as follows:
| Measurement | Value |
|---|---|
| Temperature | 78.3°F |
| Relative Humidity | 75.9% |
| Dewpoint | 70.1°F |
| Pressure | 991.39hPa |
| Wind | 303° @ 26 MPH |
We stopped again about 1/4 mile down at 7:25 about 1 mile southwest of Mapleton.
| Measurement | Value |
|---|---|
| Temperature | 77.9°F |
| Relative Humidity | 76.5% |
| Dewpoint | 69.9°F |
| Pressure | 991.29hPa |
| Wind | 304 @ 25 MPH |
We then stopped a minute or so later near a bridge just prior to Poplar Ave as the tornado was nearing it’s maximum as it entered Mapleton. At this point we were about half a mile from the tornado.
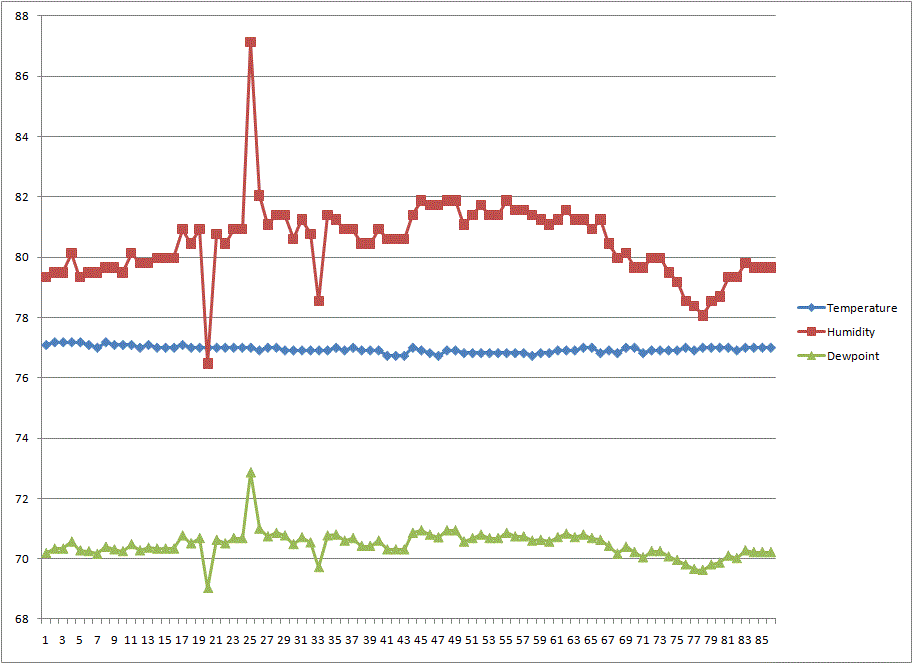
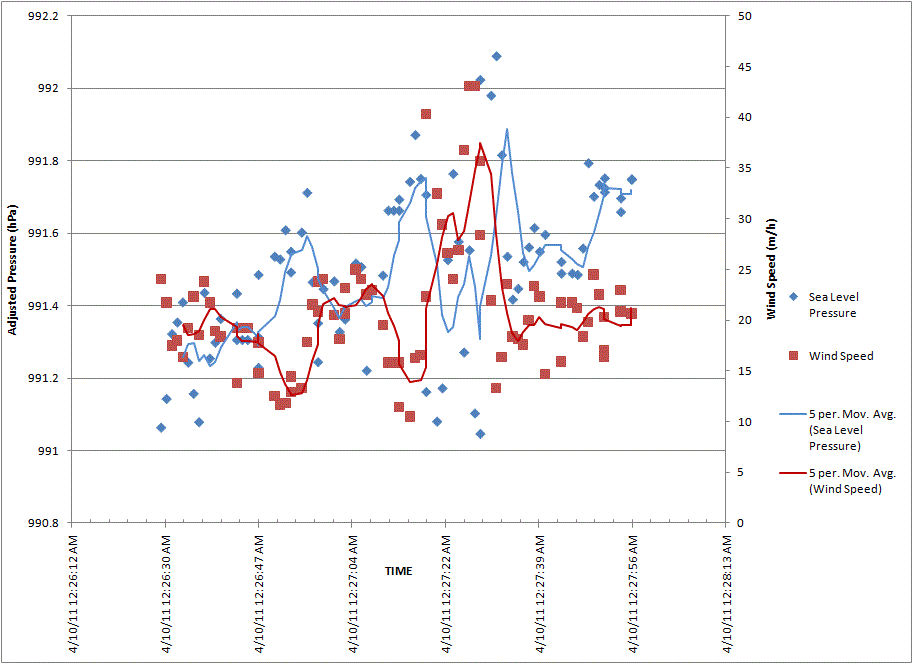
The temperature, humidity and dewpoint here is relatively unchanged. Temperature was steady at 77, humidity hung right around 80%, which meant the dewpoint was stable at 70.5. What is interesting is the pressure perturbations we recorded at this distance from the tornado. Between 7:27:23 and 7:27:28 (5 or 6 seconds) the pressure dropped from 991.76 hPa to 991.04 hPa. That’s only .72 hPa within 5 seconds, but we were half a mile from the tornado. There was also a double dip on the pressure graph at this point, not sure what that is. Here are the graphs during this 87 second data grab (from 7:26:29 to 7:27:56). You’ll also see during the double pressure dip is when the highest winds of 28 – 43 mph were recorded, something going on there.
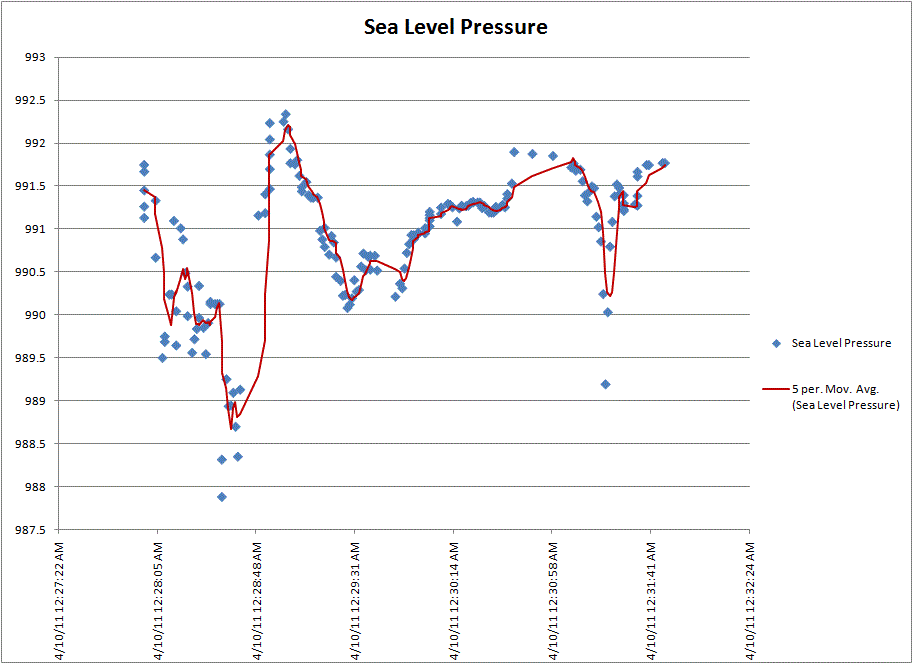
After this we followed the tornado into Mapleton, and on the way there recorded two more significant pressure drops as the tornado reached it’s peak on the southwest side of town. At 7:27:59, the pressure was at 991.75 hPa. At 7:28:33 (34 seconds later) it bottomed out at 987.88 hPa. That is a 3.87 hPa drop in just 34 seconds. A few seconds after it bottomed out, is when I measured a wind gust of 76.8 mph from the north (6°). Also, during this 9 second period, the average wind speed was 60 mph from the north. The following two graphs encompass the time from 7:27:59 to 7:31:47.
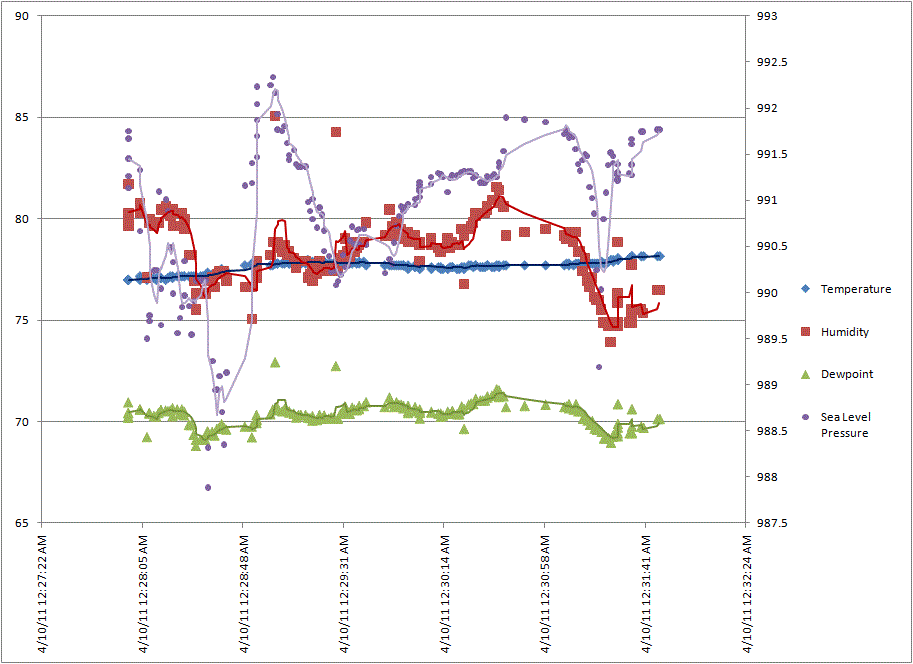
And below is a graph of the temperature, humidity and dewpoint with the above pressure mapped as well. The two big pressure drops coincided with drops in humidity which is also when the highest winds were, which makes me wonder if the wind gusts are, in fact, RFD related rather than the outer circulation of the tornado as we had postulated prior.
So, that’s a little taste of the data collection performed by my custom built mesonet during this event. Did I uncover and groundbreaking information? Nah. Do I find it interesting that I recorded decent pressure drops within half a mile of the tornado? Yeah, I gotta say that’s pretty cool. Should you be interested in the dataset, which contains GPS coordinates; vehicle heading & speed; environmental temperature, pressure, humidity and dewpoint as well as uncorrected wind and wind direction at a sample rate of roughly one second, feel free to contact me. Just remember the disclaimer presented in the first paragraph of this entry 😉


